Pavlides S., Chatzipetros A., Sboras S., Kremastas E. and Chatziioannou A.
Earthquake Geology Research Team
Thessaloniki, Greece
12 March 2021
Earthquake Geology Research Team
Thessaloniki, Greece
12 March 2021
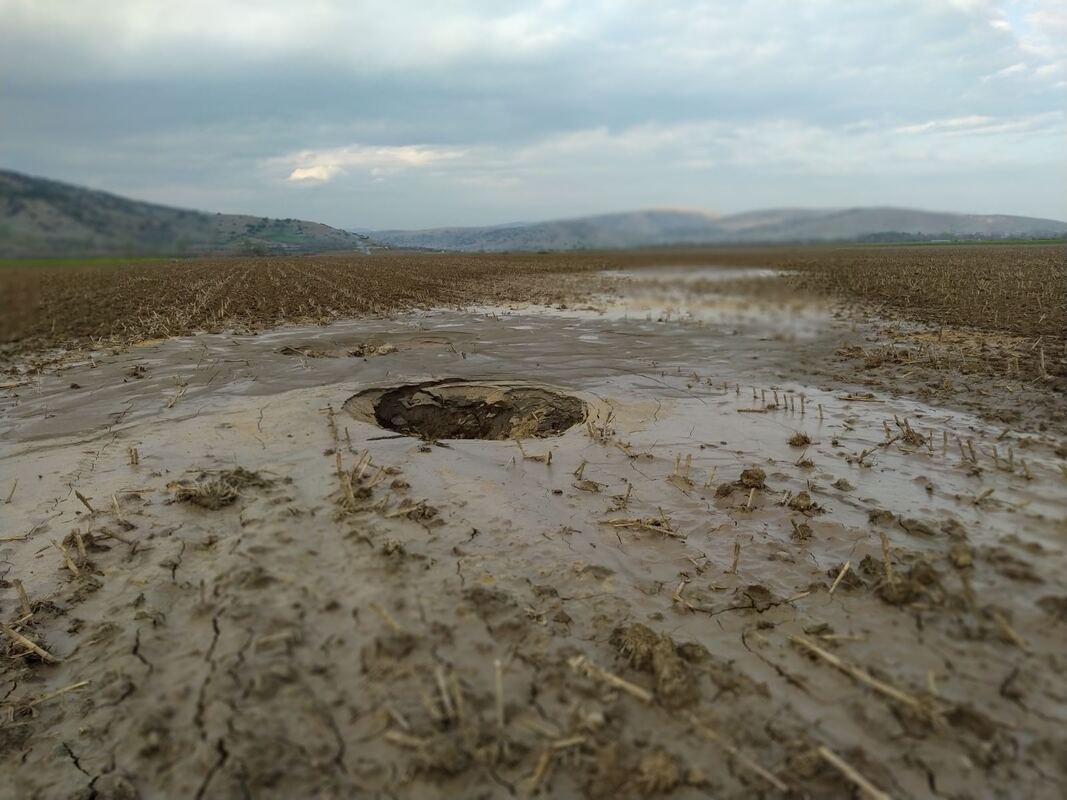
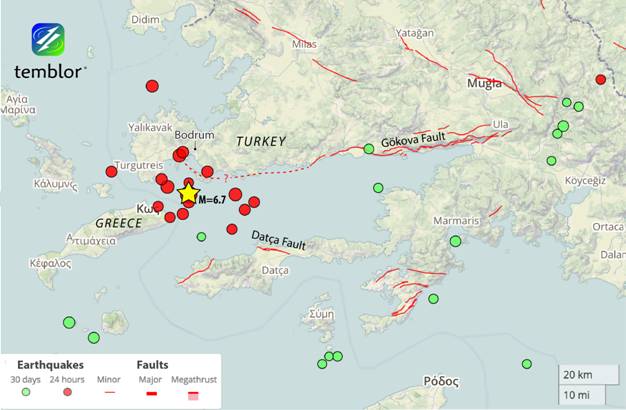
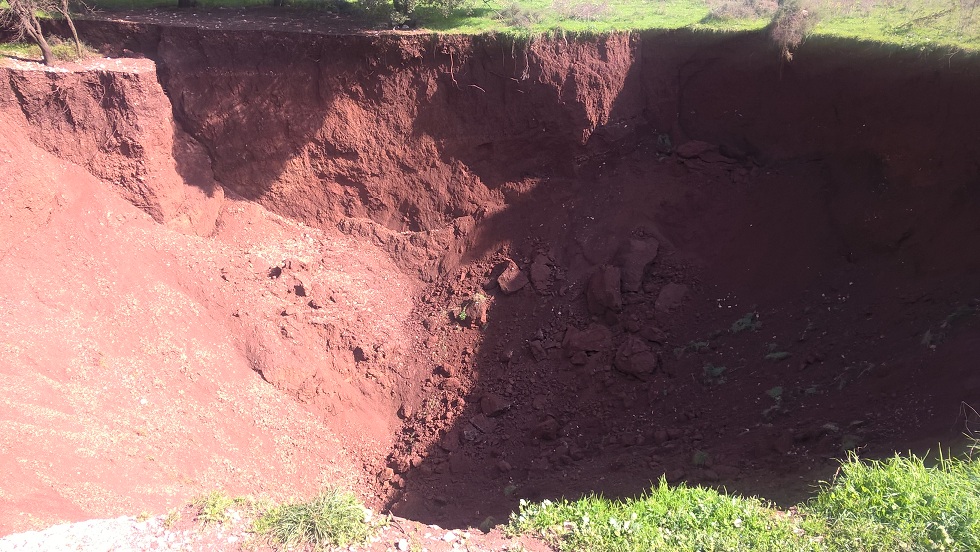
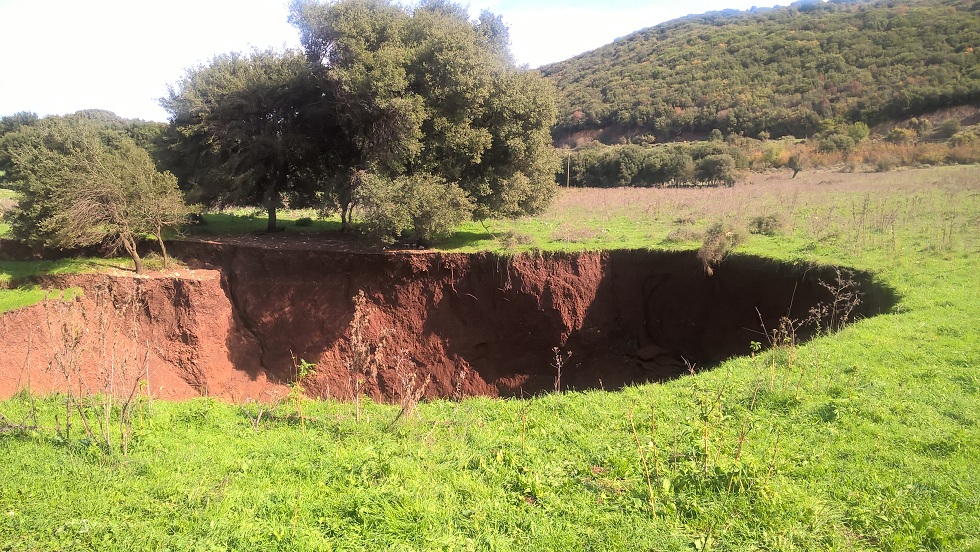
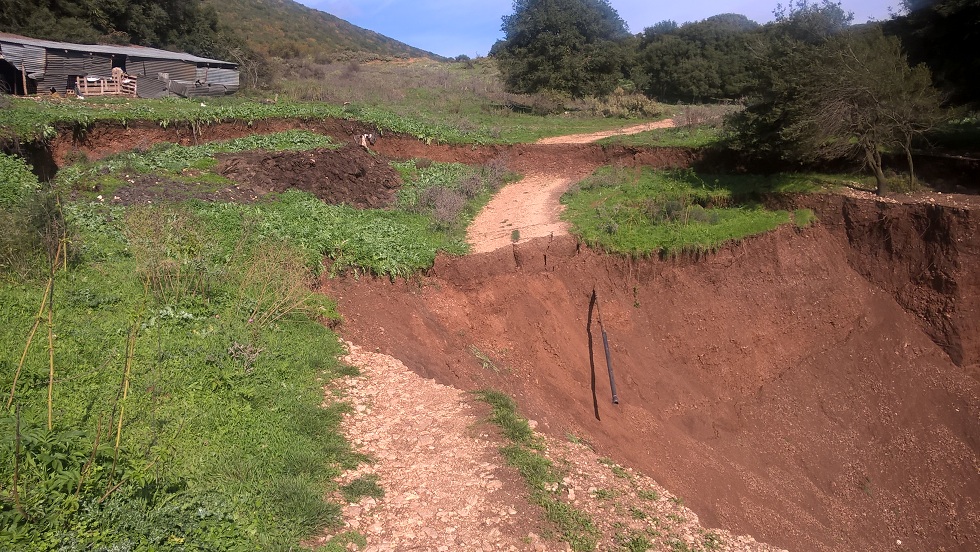
The strong earthquakes of ML6.0 and ML5.9 (IG-NOA), or Mw6.3 and mb5.8 (CSEM-EMSC) of March 3 and 4, respectively, affected a large area, due to the surprisingly low dip angle of the causative fault plane. Surficial effects of the earthquake sequence consist of a variety of phenomena that were observed all over the area. Dozens of soil liquefaction occurrences, such as sand “craters" and flows (Fig. 1) were mapped in areas adjacent to Pinios and Titarisios rivers.
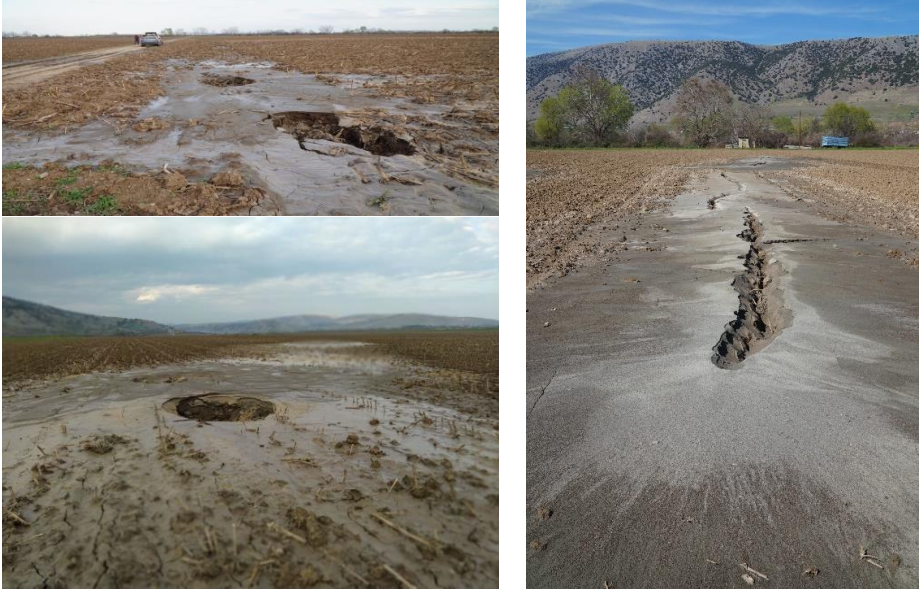
Fig. 1. Examples of sand flow and craters in the liquefied area SE of Pineiada village.
The first area is located between the villages of Koutsochero to Pineiada and Zarko, while the latter is less extended and is observed mainly in the area of Vlachogianni and Varko villages. All the liquefaction phenomena were mapped in detail with UAVs (Fig. 2). Comparison with current and historical satellite images, show that in the area of Pinios river the liquefaction is clearly associated with older abandoned meanders of the river, indicating a differentiated composition, more susceptible to liquefaction (Fig. 3). Liquefaction susceptibility map of Greece and GIS-based DAtabase of historical Liquefaction Occurrences in broader Aegean region, (DALO v1.0) have been created (Papathanassiou and Pavlides 2009, Papathanassiou et al., 2010a), whilst evaluating earthquake-induced liquefaction in the urban areas and more specific in Larissa city have been published by Papathanassiou et al. (2010b, 2011).
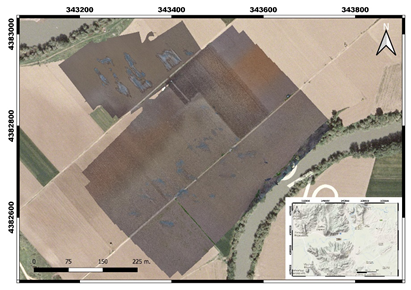
Fig. 2. An example of orthorectified image of the liquefied areas (gray spots). Images from a series of high flying UAV campaigns have been combined with orthophotos from the Cadastral project of Greece.
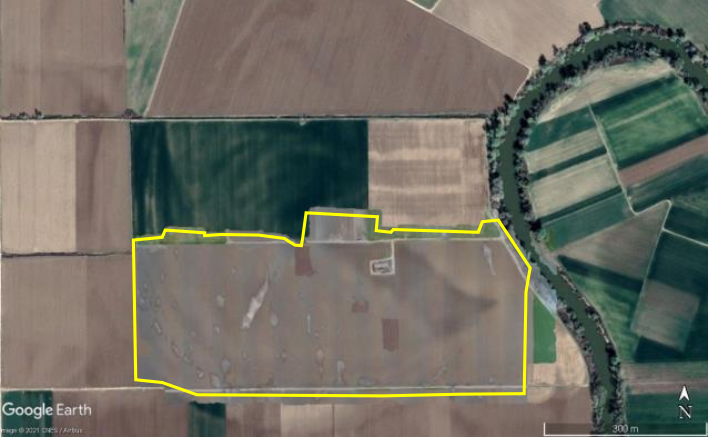
Fig. 3. A detailed UAV composite orthophoto (yellow border) overprinted onto a satellite image, clearly shows that the distribution of individual liquefaction features (gray spots) coincides with an abandoned and filled bend of Pinios river. The current riverbed is visible at the right part of the map.
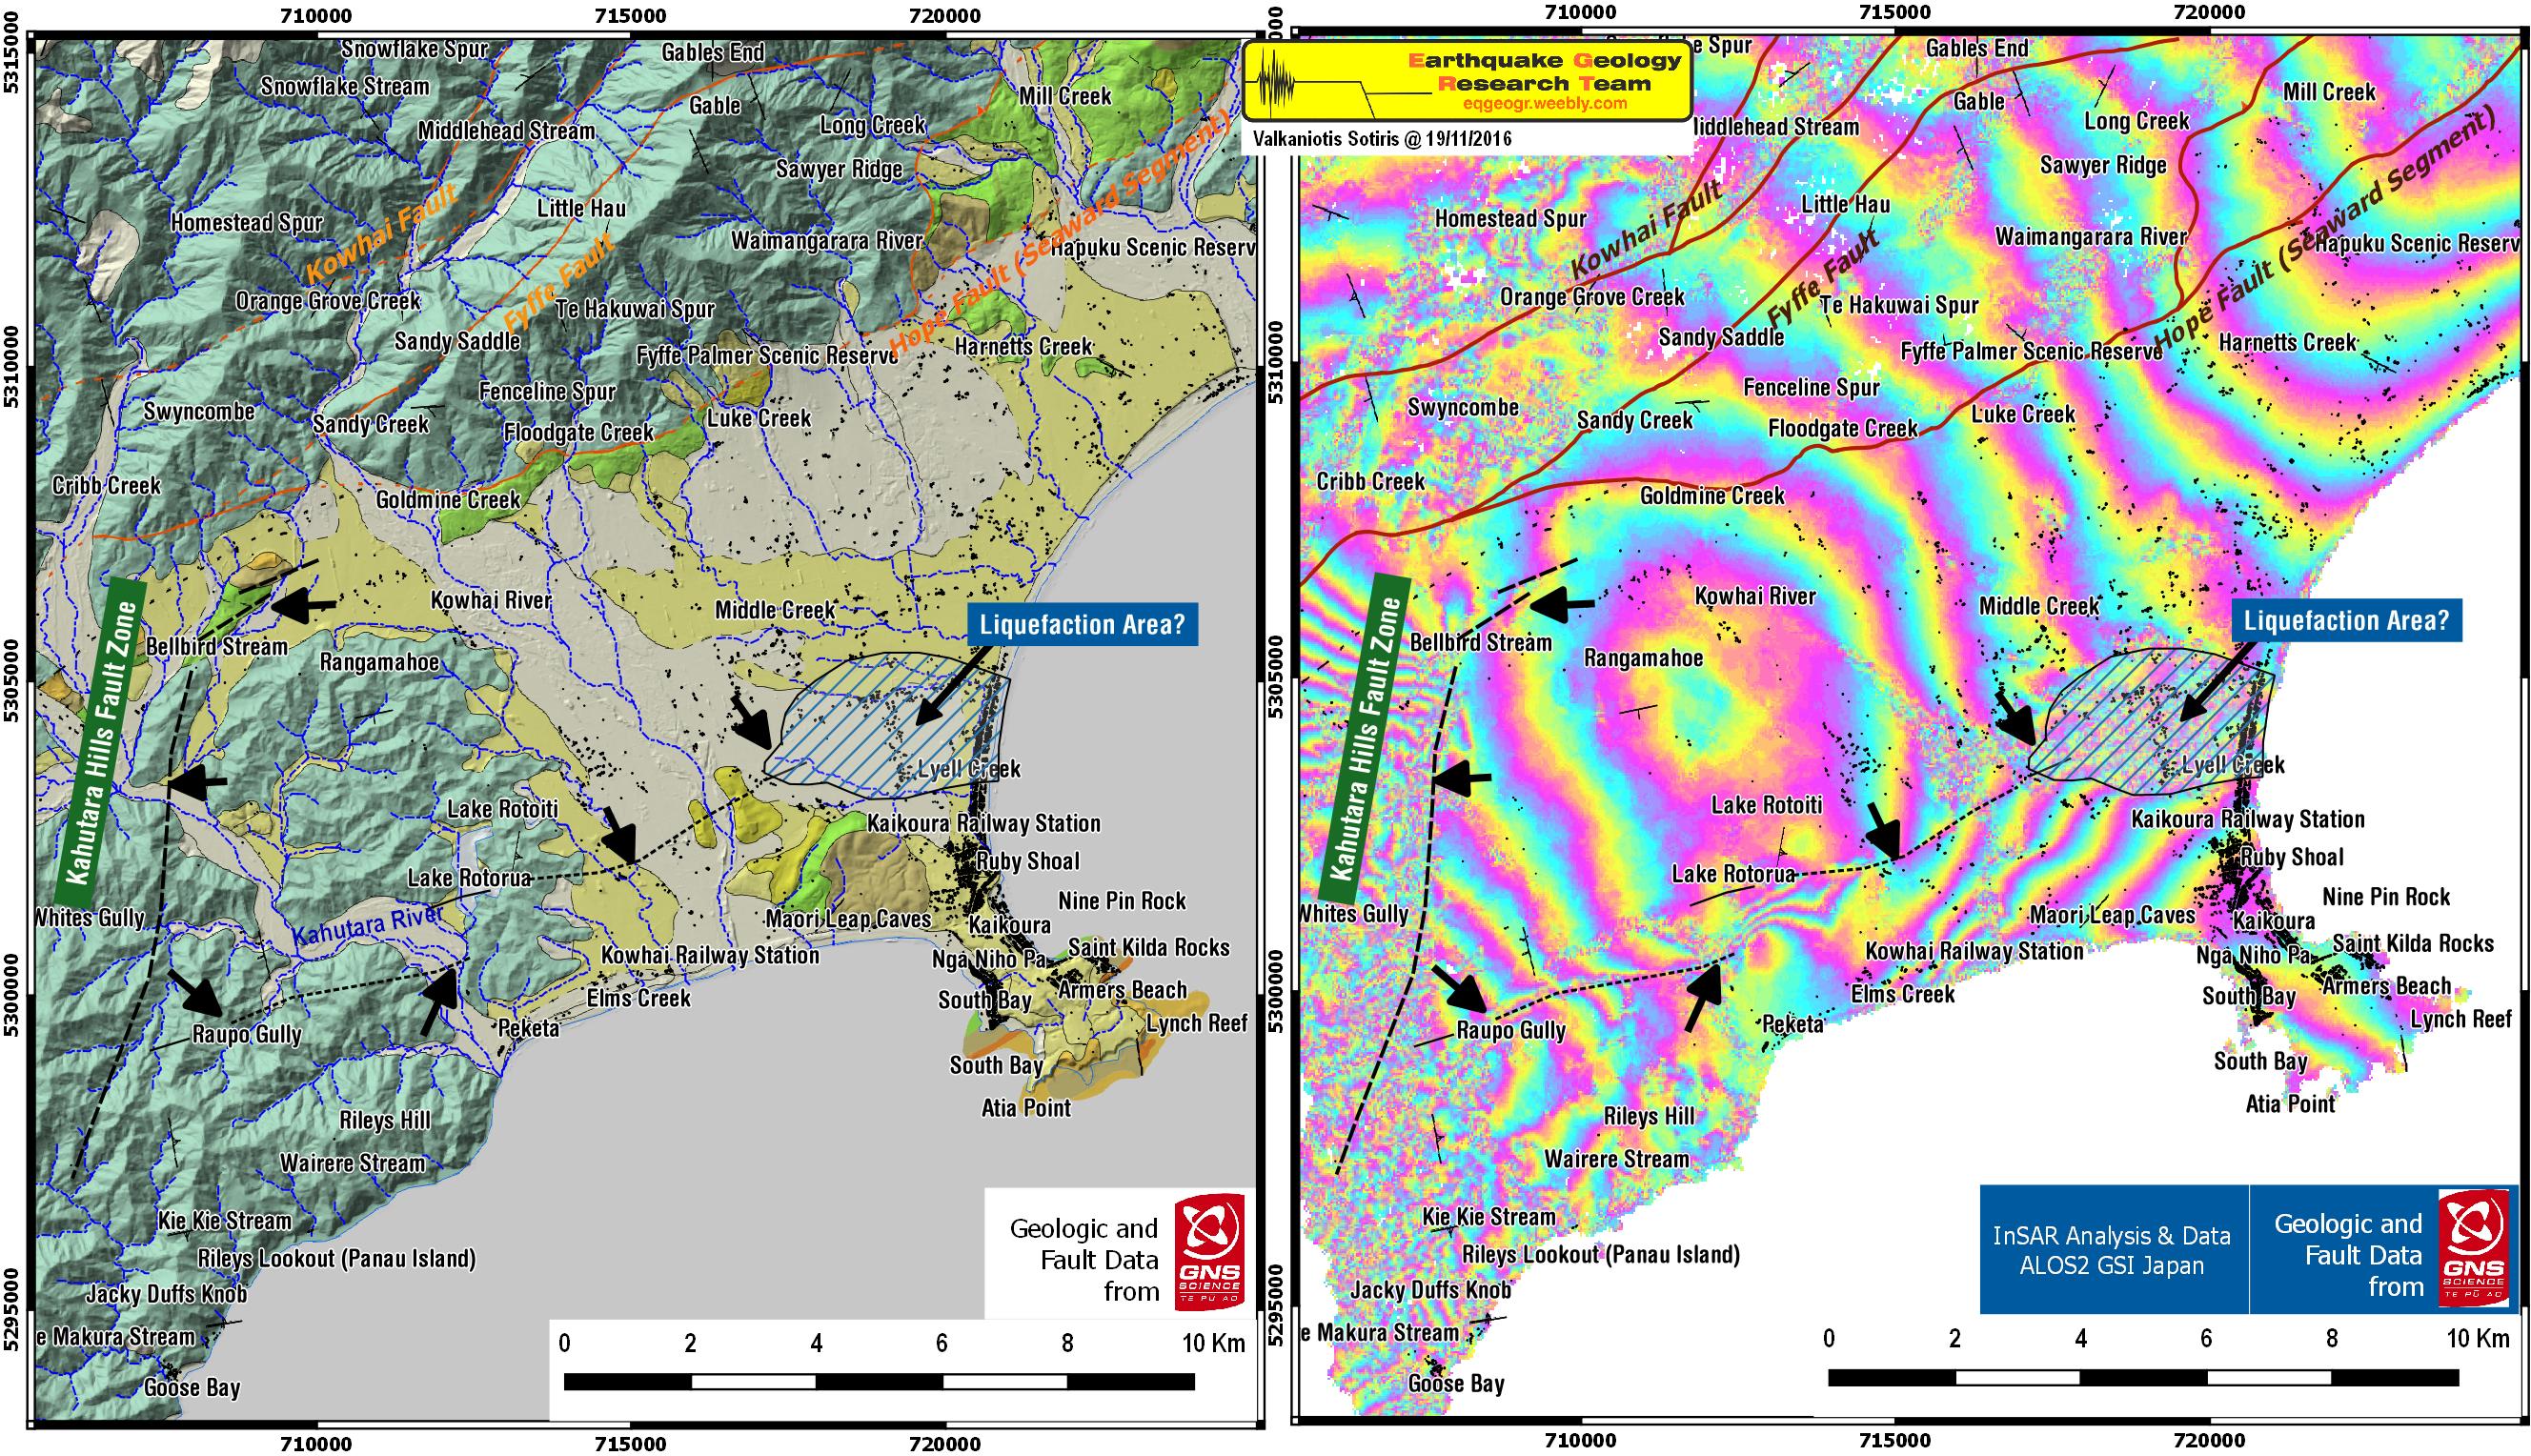
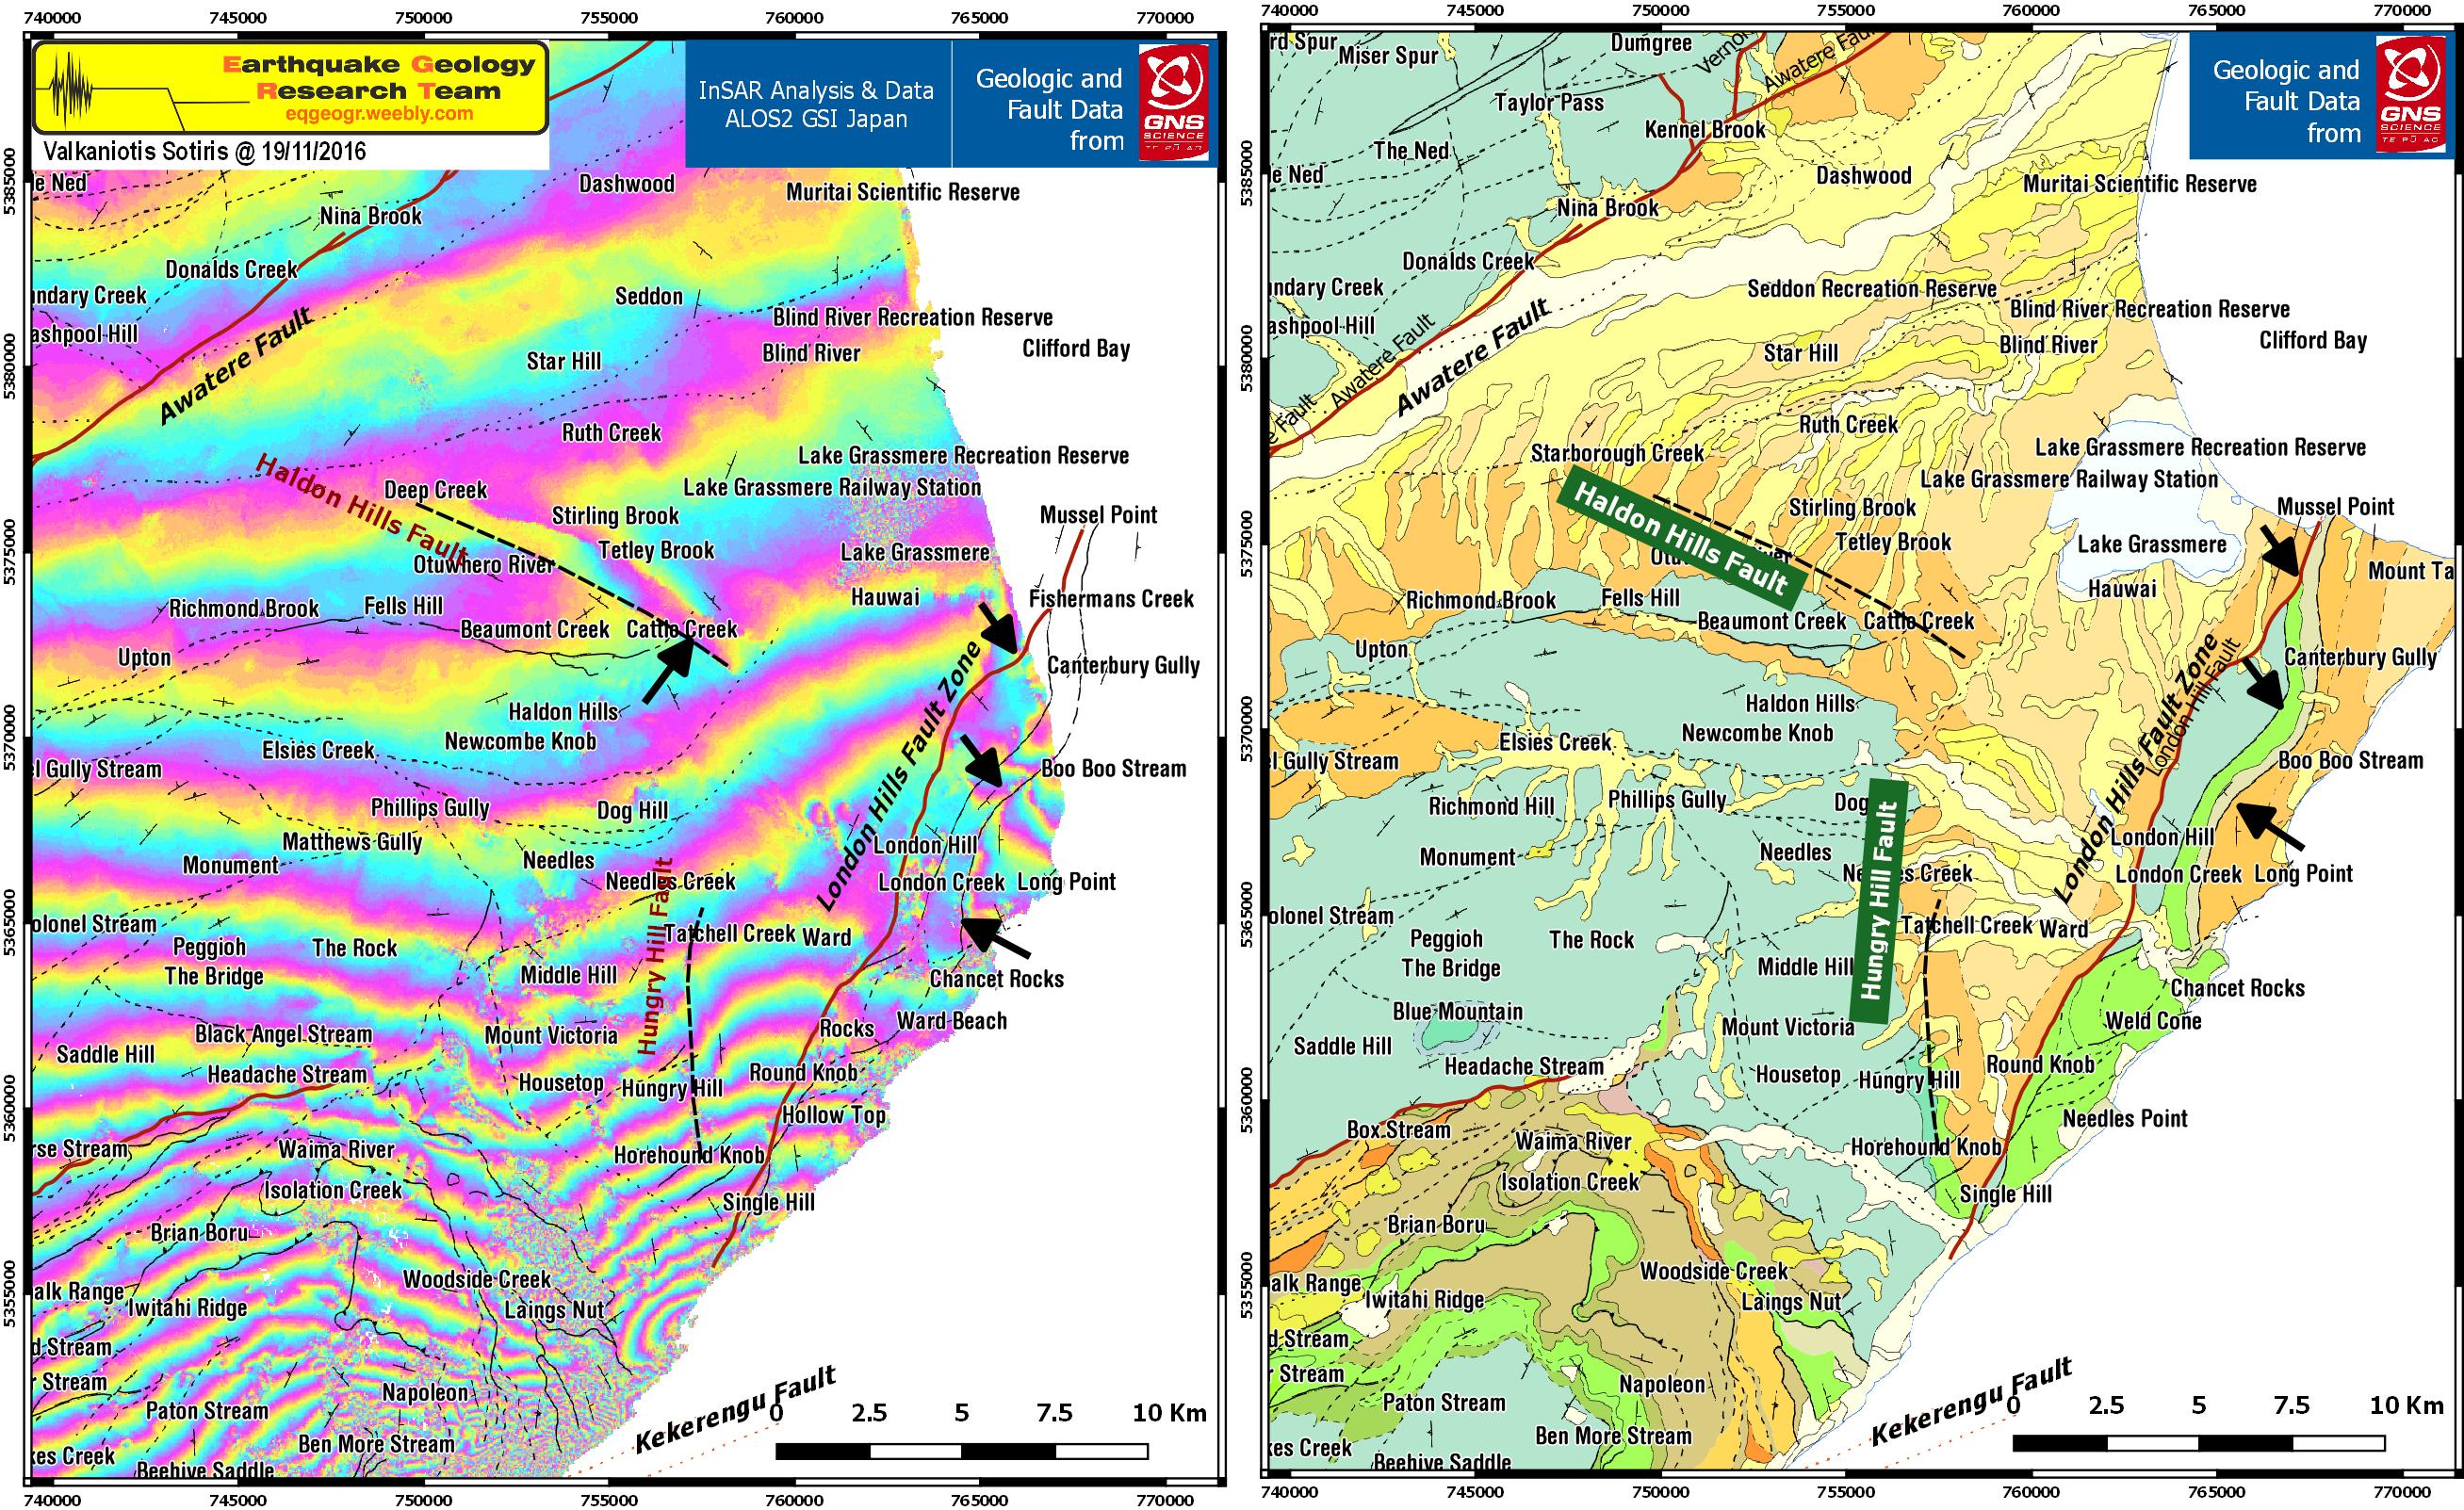
Field work and the analysis of interferometric information (Fig. 4a,b, Foumelis personal communication) show that the well-known and studied Tyrnavos fault (TF, Fig. 4), as well as the Titarisios valley fault, which is the NW extension of the known Larissa fault (LF, Fig. 4), did not generate the mainshock, although they appear to have been triggered and partially activated by the main seismogenic fault as sympathetic structures.
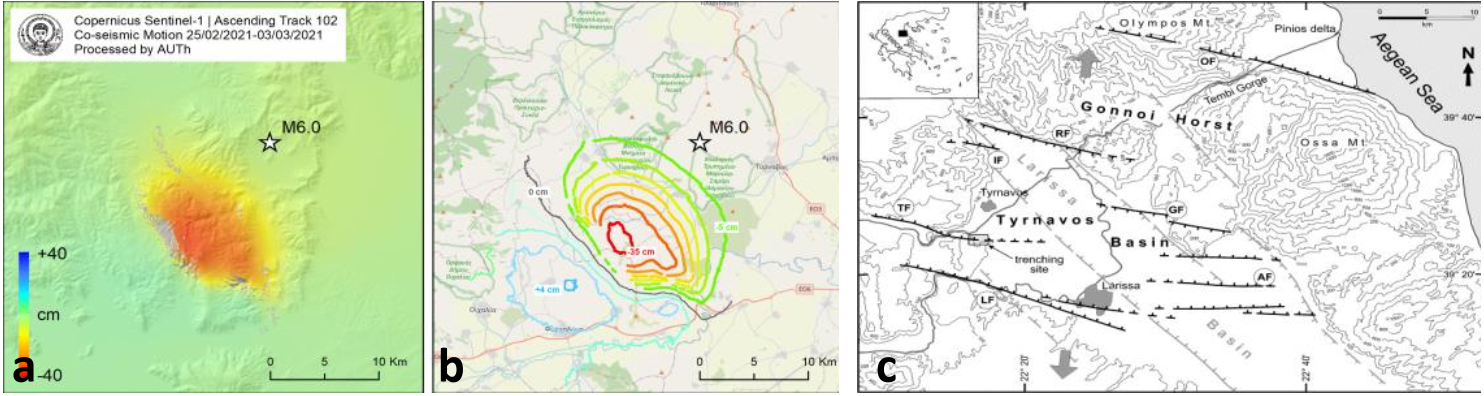
Fig. 4. InSar maps (a, b, Foumelis, personal communication) and simplified map of the North Thessaly fault system (a, b, Foumelis, AUTh, c, Caputo et al., 2004).
Tyrnavos fault (TF, Fig. 4) is a typical geological structure similar to many others in the broader area (Caputo and Pavlides, 1993; Caputo, 1995; Caputo et al., 2004). It strikes West-Northwest and has a surficial length of 10-12 km. This fault is one of the best studied active structures in Greece for more than 30 years by the Earthquake Geology Research Team of AUTh in collaboration with R. Caputo, Professor at University Ferrara and is included in the Greek Database of Seismogenic Sources (GreDaSS http://gredass.unife.it, Sboras, 2011; Caputo et al., 2014, 2012; Caputo and Pavlides, 2013; Sboras et al., 2014), in which it is described in detail. According to geological data, geophysical surveys and palaeoseismological excavations studying the geological history of the fault, a slow activity is documented, which is characterized by vertical surface co-seismic displacements of 20-40 cm and a possible recurrence period of about 1-2.5 ka, as well as a low slip rate of 0.05-0.25 mm/year. Its earthquake potential is estimated to M 6.1 to 6.3 (Caputo et al., 2004), based on the empirical relationships Ms versus SRL of Pavlides & Caputo (2004) and Wells and Coppersmith (1994). The active deformation of the area is also well documented by recent primary geodetic data analysis (Chatzipetros et al., 2018; Lazos et al., 2020).
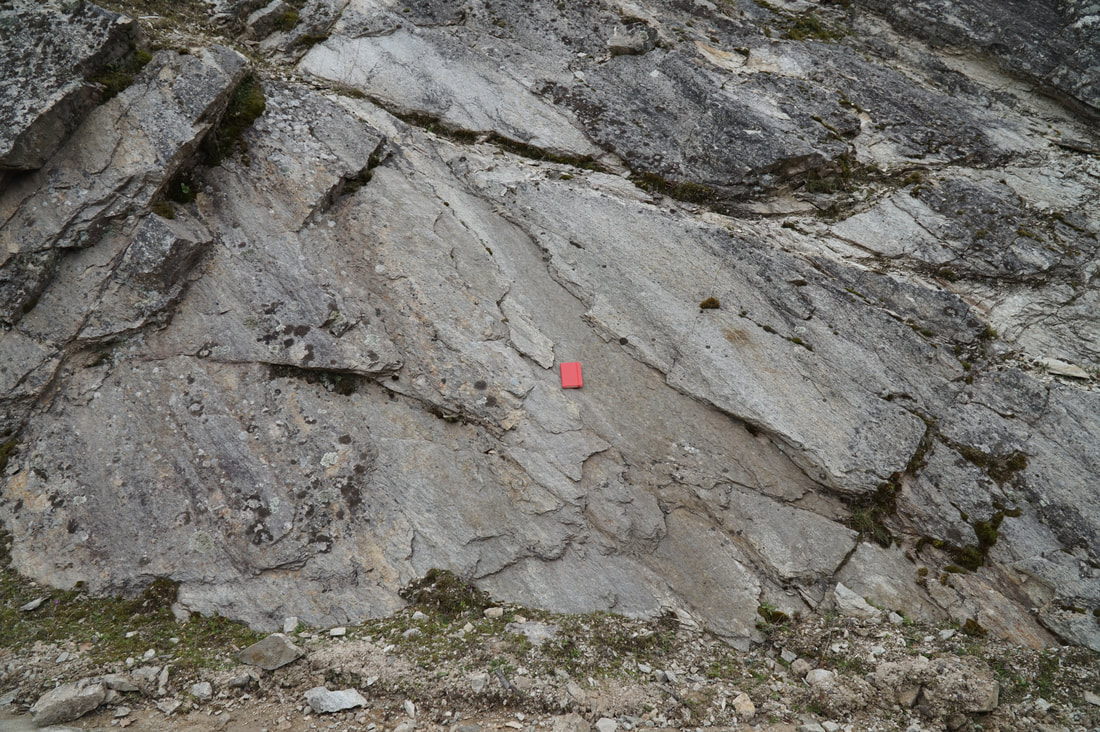
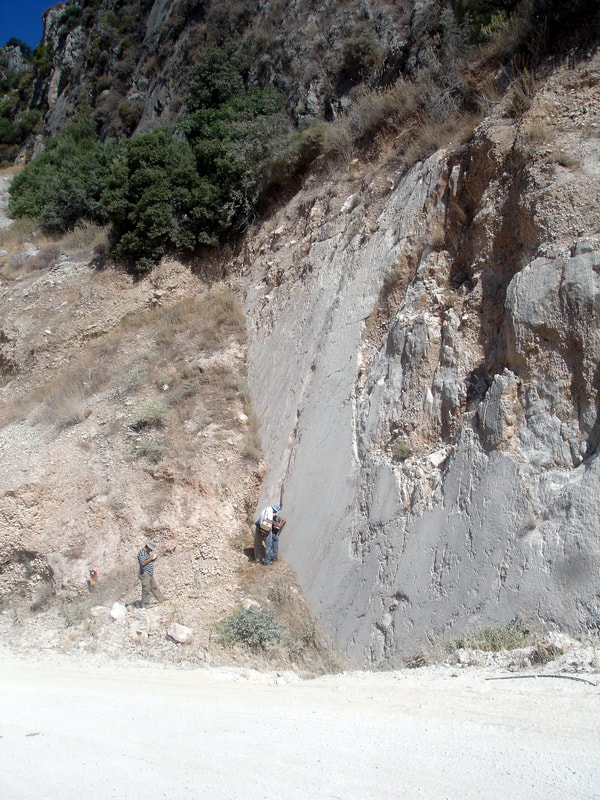
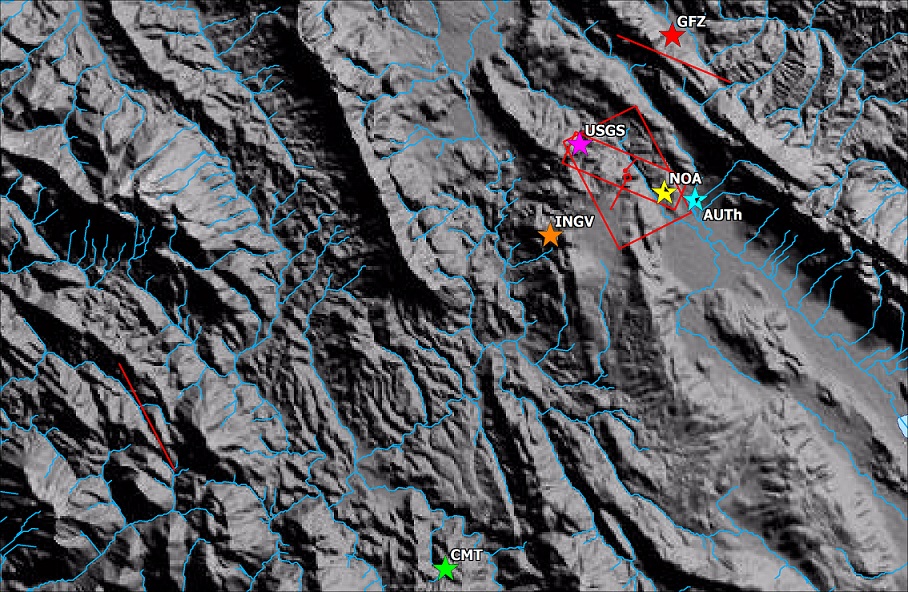
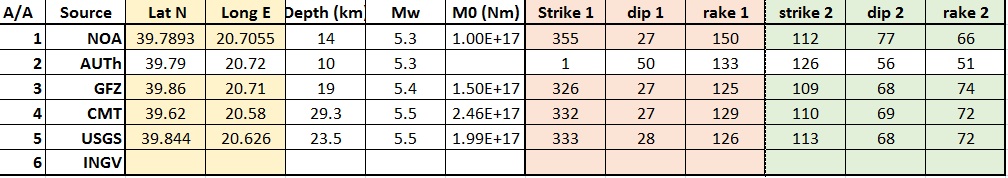
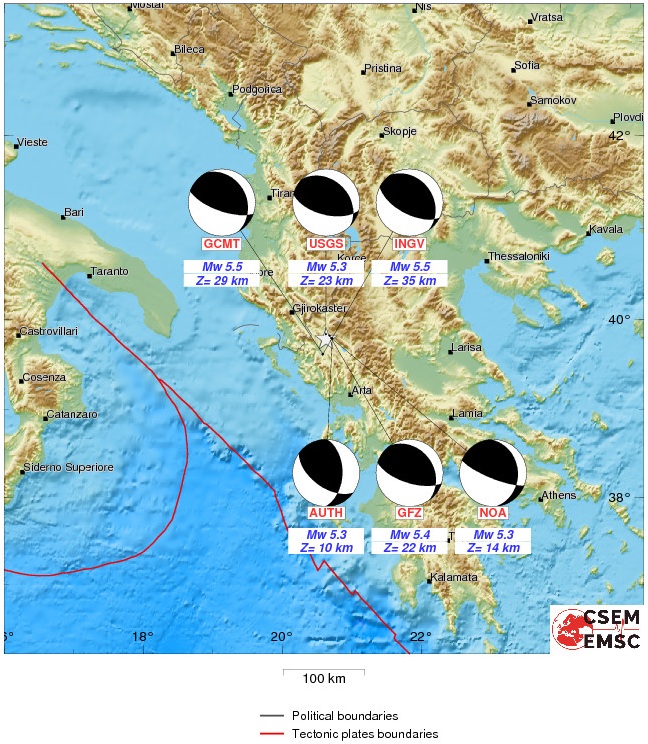
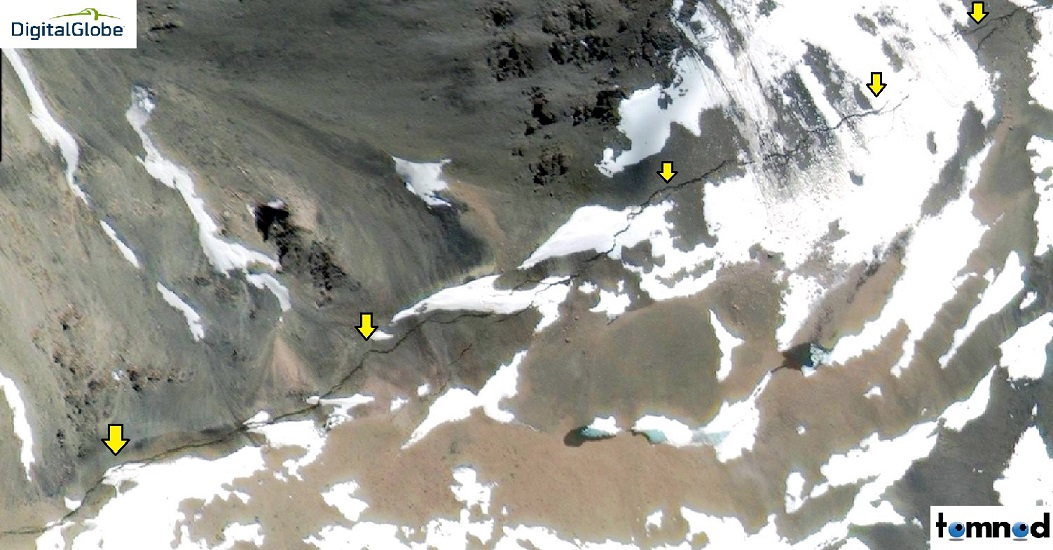
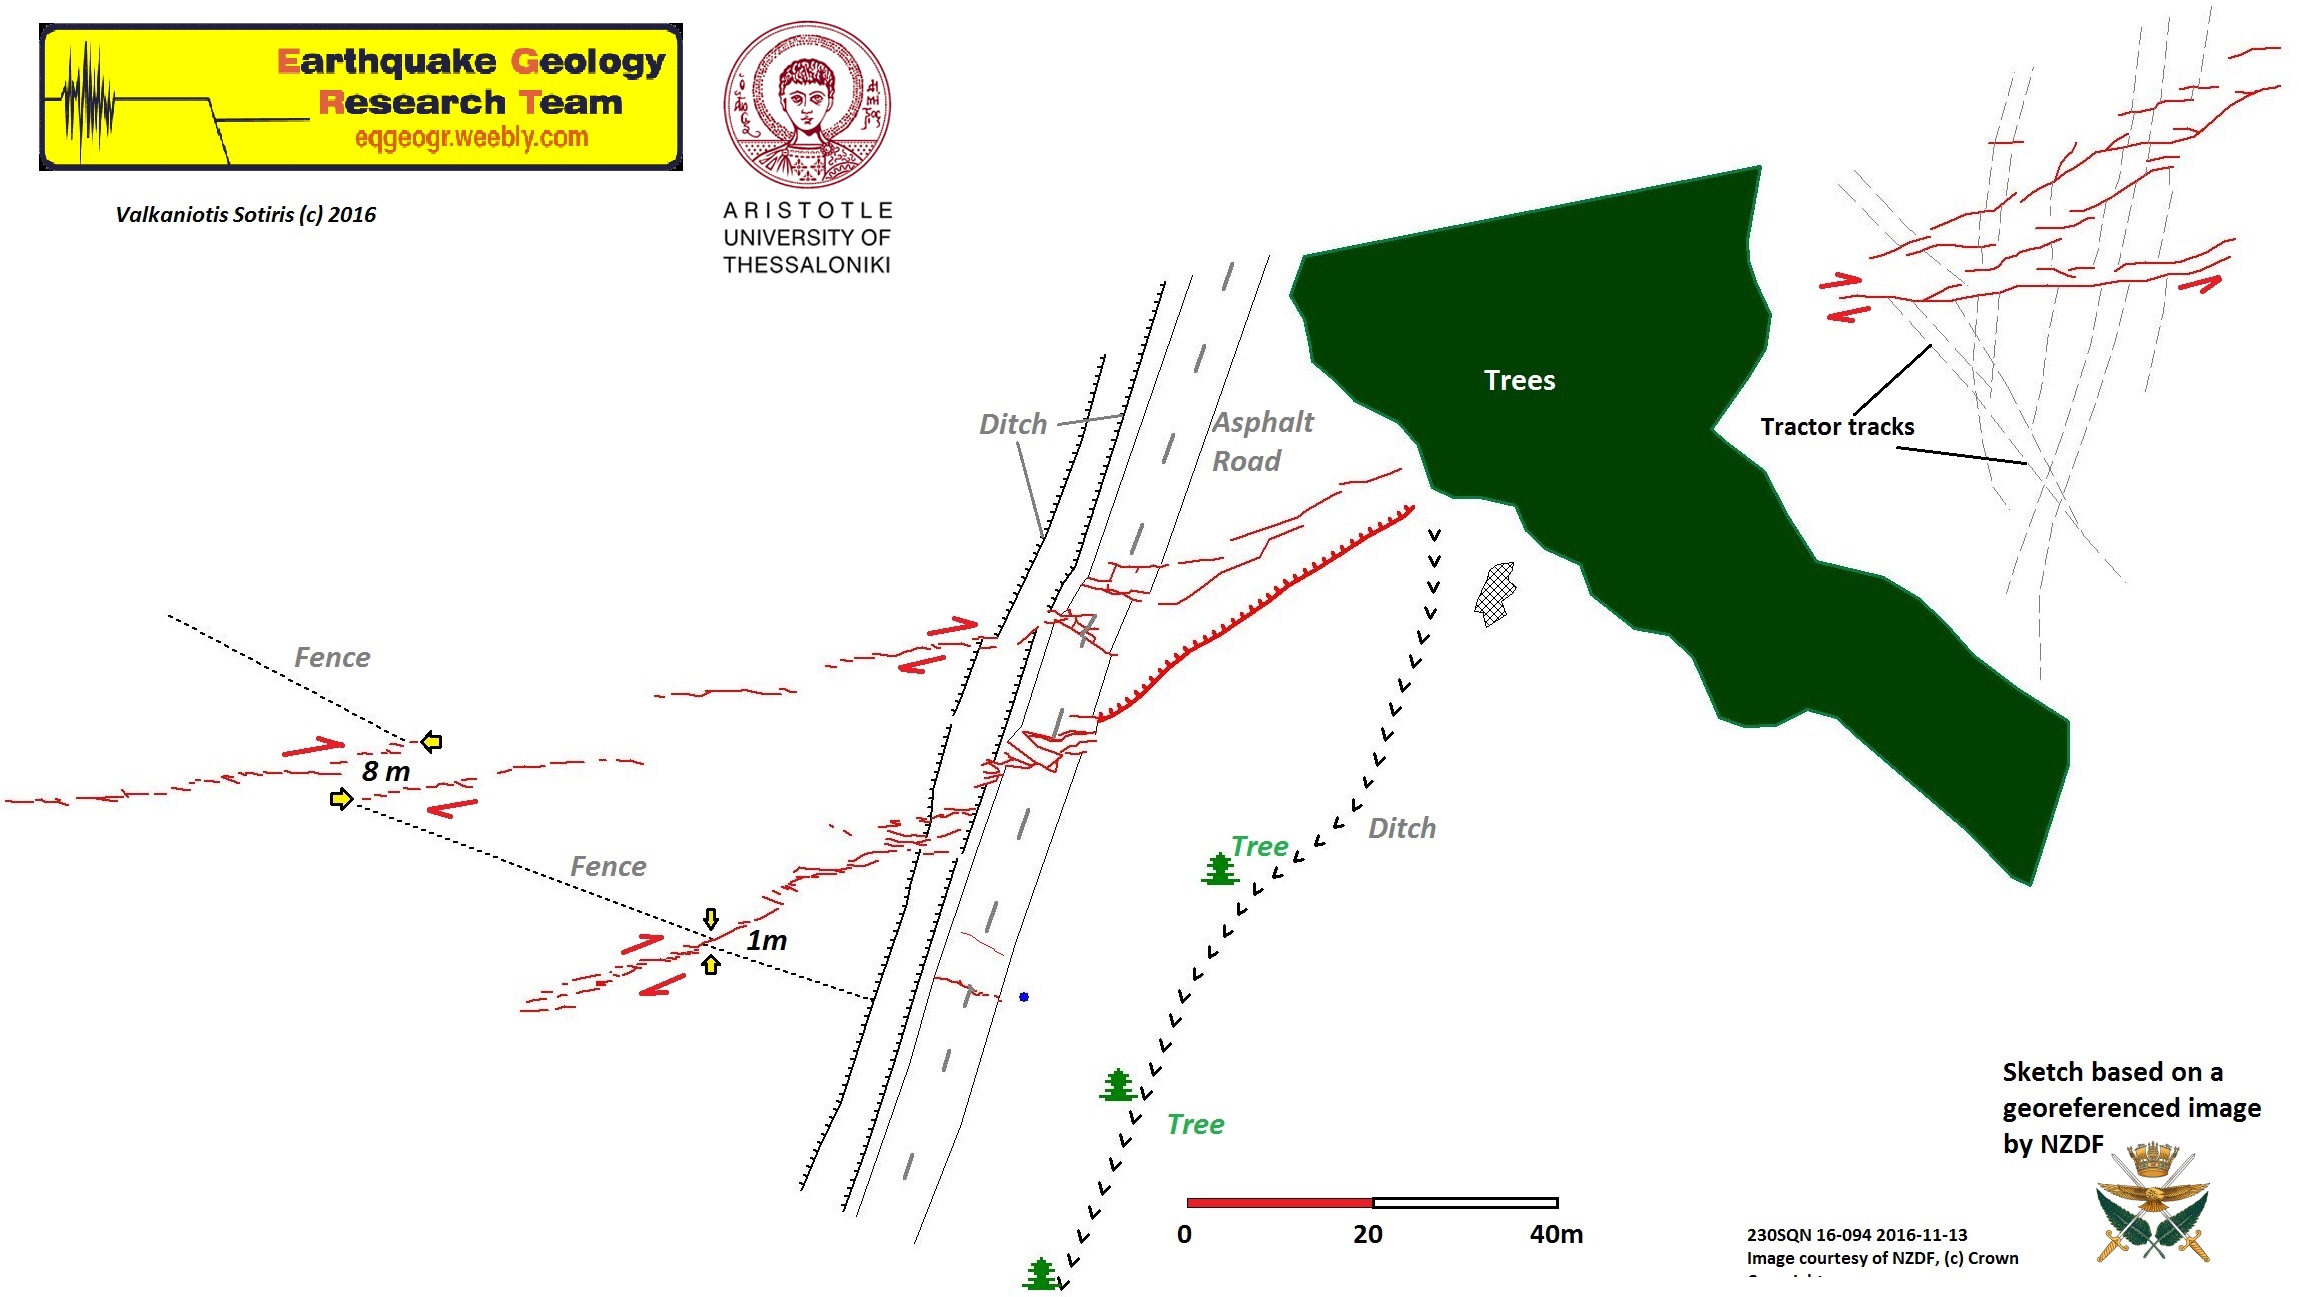
As far as the insofar unknown and unmapped seismic fault is concerned, fieldwork showed that there are characteristic geological indications in the Pelagonian bedrock, consisting of Paleozoic mica schist and gneiss (e.g. Kilias and Mountrakis, 1987; Kilias et al., 1991), indicating that a low angle normal fault has acted as a hidden or blind fault during the earthquake. It is associated with the bedrock schistosity, as well as with small high angle reverse faults of the Pelagonian anticline. The presumed seismic fault extends in the broader area between the villages of Zarko and Megalo Eleftherochori, as an inherited shear zone (Fig. 5). Geologic indications include outcrops of the post Alpine shear zone (Fig. 5a,b,c), located along the boundary between interferometrically-indicated uplift and subsidence terrains (fig. 4, that is 0 line of displacement), the existence of cataclasite and fault gouge in the shear zone (Fig. 5a-e), which indicates reactivation of the fault in brittle conditions during the neotectonic period (inverse tectonics) and slickenlines compatible with the active stress field (Fig. 5a,c,d). Fault surfaces strike at N160oE and dip at 50o on average which is in good agreement to the published focal mechanisms by Greek (NOA and AUTh) and other international Institutes. Coseismic indicators include small, ruptured fault surfaces with detached rock slabs and pieces, as well as small-scale soil fractures following the trace of the mapped fault (Fig. 5d,g), with negligible vertical displacement and small heave (up to 2 cm).
As far as the insofar unknown and unmapped seismic fault is concerned, fieldwork showed that there are characteristic geological indications in the Pelagonian bedrock, consisting of Paleozoic mica schist and gneiss (e.g. Kilias and Mountrakis, 1987; Kilias et al., 1991), indicating that a low angle normal fault has acted as a hidden or blind fault during the earthquake. It is associated with the bedrock schistosity, as well as with small high angle reverse faults of the Pelagonian anticline. The presumed seismic fault extends in the broader area between the villages of Zarko and Megalo Eleftherochori, as an inherited shear zone (Fig. 5). Geologic indications include outcrops of the post Alpine shear zone (Fig. 5a,b,c), located along the boundary between interferometrically-indicated uplift and subsidence terrains (fig. 4, that is 0 line of displacement), the existence of cataclasite and fault gouge in the shear zone (Fig. 5a-e), which indicates reactivation of the fault in brittle conditions during the neotectonic period (inverse tectonics) and slickenlines compatible with the active stress field (Fig. 5a,c,d). Fault surfaces strike at N160oE and dip at 50o on average which is in good agreement to the published focal mechanisms by Greek (NOA and AUTh) and other international Institutes. Coseismic indicators include small, ruptured fault surfaces with detached rock slabs and pieces, as well as small-scale soil fractures following the trace of the mapped fault (Fig. 5d,g), with negligible vertical displacement and small heave (up to 2 cm).
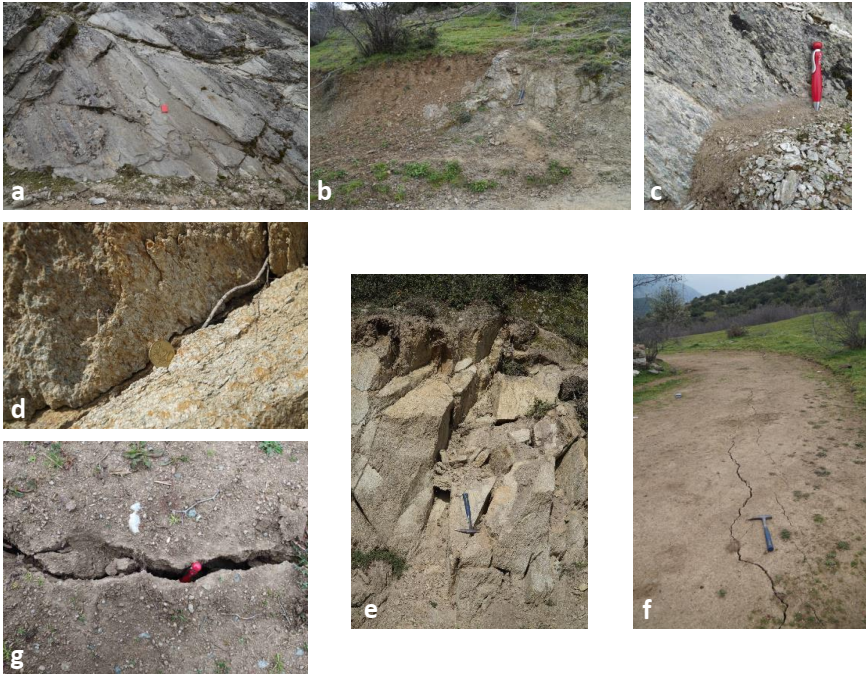
Fig. 5. a. Fault surface of the low-angle normal fault in the bedrock, believed to be a strand of the causative fault zone. b. a zone of intense brittle shearing, accompanied by fault gouge and cataclasite within the low-angle normal fault zone. c. fault surface. d. opening along a pre-existing shear zone. e. cataclasite and opening in Paleozoic crystalline rocks. f, g. coseismic surface cracks in the soil cover, following the inferred strike and location of the causative fault zone in the bedrock.
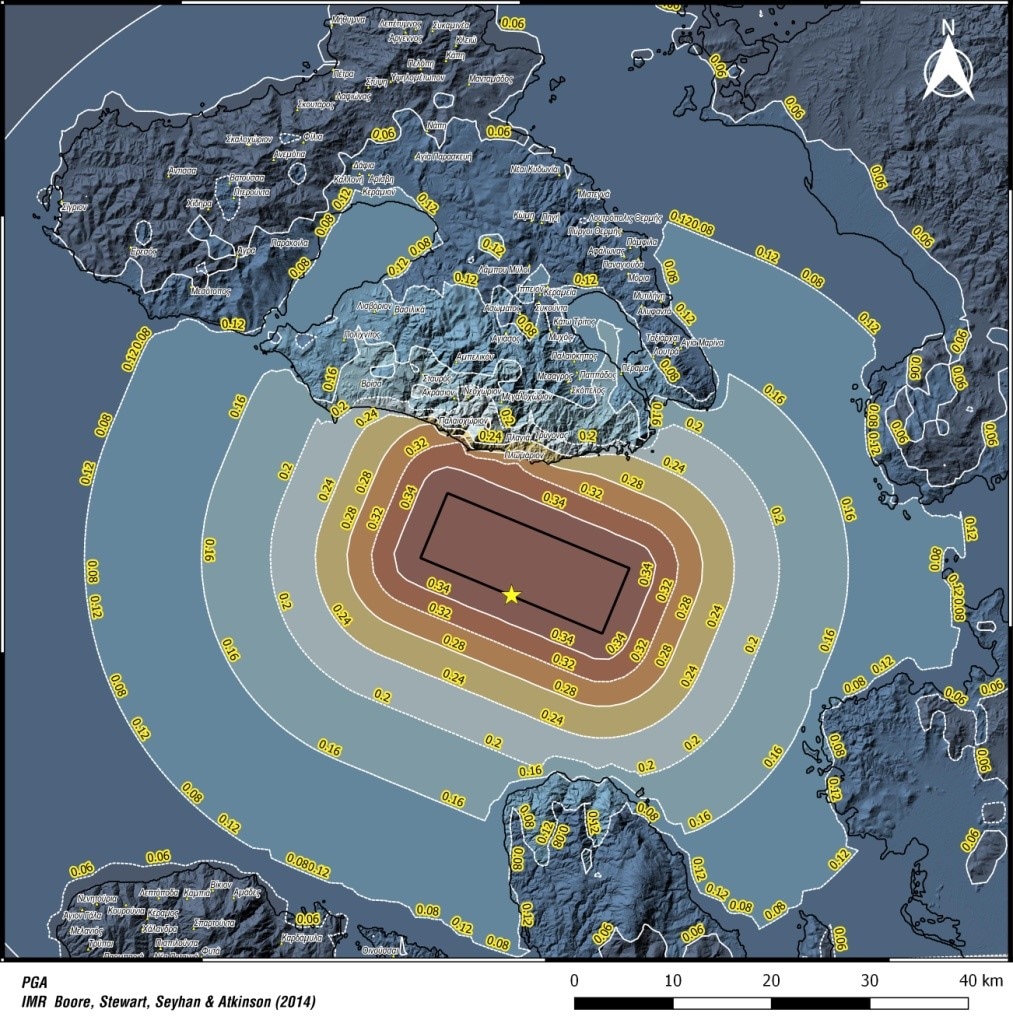
The seismic fault model (seismic source) of the mainshock is based on the GFZ’s moment tensor solution (strike, dip and rake), the scalar relationships of Wells & Coppersmith (1994; length and width), and the interferograms along with the site observations (position). The Coulomb static stress changes are calculated for receiver faults similar to the seismic source at a depth of 8 km. A vertical cross-section normal to the source’s strike is also calculated. Results show stress-load beyond the tips of the fault, suggesting a triggering scenario for faults of similar geometry and kinematics located in this red area (Fig. 6). The northwestern edge of the fault (red-yellow) activated during the second event of 4th of March. The seismic source is also used to model the vertical displacement on the ground after using the Okada formulae (Fig. 7). The maximum calculated vertical displacement is 2.93 cm. Both Coulomb and Okada calculations were performed with the Coulomb v3.3 application (Toda et al., 2005; Lin & Stein, 2004).
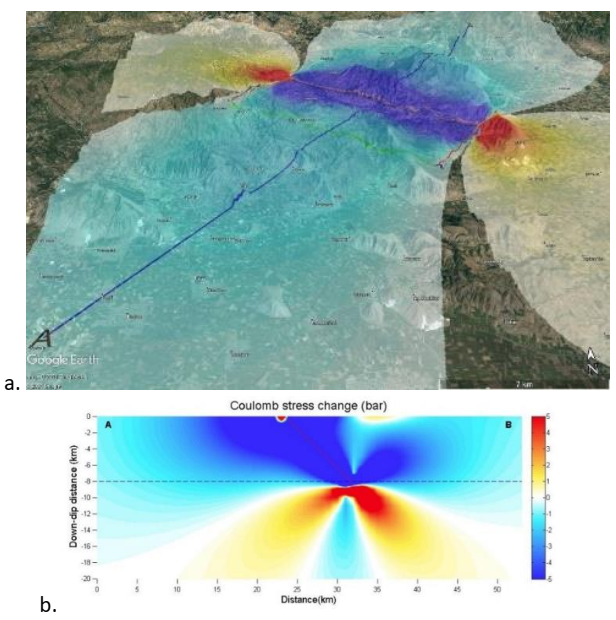
Fig. 6. a. The seismic fault model (seismic source) of the mainshock is based on the GFZ’s moment tensor solution. The Coulomb static stress changes were calculated at the depth of 8 km. b. Vertical cross-section normal to the source’s strike (A-B). Results show stress-load beyond the tips of the fault, suggesting a triggering scenario for faults of similar geometry and kinematics located in the red area
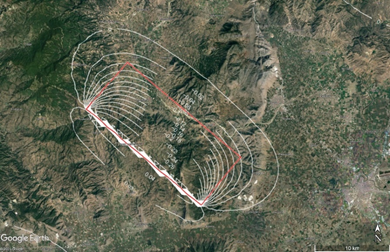
Fig. 7. A preliminary model of the seismic source is showing vertical displacement on the ground. Surface fault trace projection between the villages Zarko and Megalo Eleftherochorion.
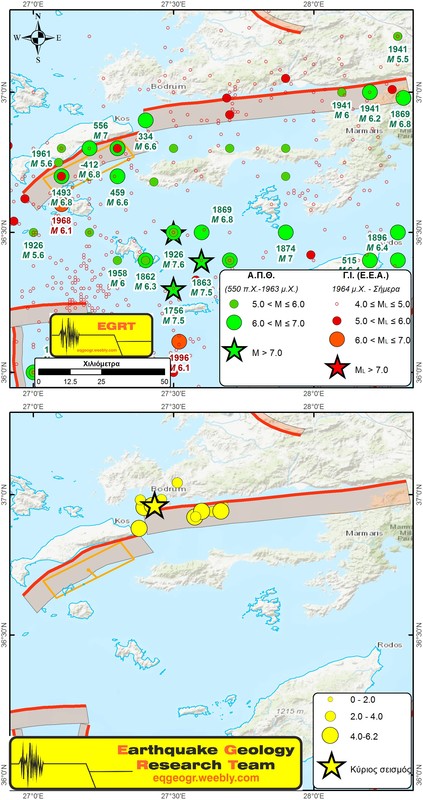
Concerning the historical seismicity of the region, important details and revisions are included in Papaioannou (2017a, 2017b, 2018, 2019). During the 20th century a similar earthquake of magnitude 6.3 occurred in Larissa on March 1, 1941, exactly 80 years ago, with very serious damage to the city and the surrounding villages, mainly in the eastern Thessalian plain, which is associated to the "Asmaki" fault (Caputo et al., 2004, Papaioannou, 2018), while another earthquake M5.6 occurred in the northwestern area in November 1901, focusing on the village of Verdikousa, probably along the extension of the seismogenic fault. Possibly the strong earthquake of 1735, with epicenter is on the same area, is associated to this fault or other structures of the area (Papaioannou 2011b). Another large earthquake in the broader area occurred on 1892 (Papazachos & Papazachou 2003; Amraseys 2009; Papaioannou, 2017a, 2019), while there is information about an earthquake of 1781 of the same magnitude. A report of an earthquake of a similar magnitude in 1766 is disputed and revised in Papaioannou (2017b). Other active geological structures of the region within the Larissa plain include Gyrtoni (Fig. 4c, GF), Rodia (RF), Elassona, Gonoi, Tempi and Omolio (OF) faults (GreDaSS http://gredass.unife.it), which are currently being studied using advanced methods (satellite imagery, high resolution UAV models, geodetic, geological and paleoseimological ones, e.g. Tsodoulos et al., 2016, Kremastas et al., 2018, Lazos et al., 2020). It is worth mentioning that the first to mention earthquakes as a possible cause of formation of Tempi valley, with the contribution of God Poseidon, is the historian Herodotus (485-425 BC).
In conclusion, this earthquake raises new questions and concerns, while revising some established views, such as:
In conclusion, this earthquake raises new questions and concerns, while revising some established views, such as:
- The status of active stress trends (σ3 extension),
- The direction of active tectonic structures,
- The existence of a seismogenic fault in a mountainous volume of crystalline rocks without typical geomorphological expression,
- The role of blind faults to Seismic Hazard Assessment.
References
- Ambraseys, N., 2009. Earthquakes in the Mediterranean and Middle East. Cambridge Univ. Press.
- Caputo, R., 1995. Inference of a seismic gap from geological data: Thessaly ( Central Greece) as a case study. Annals of Geophysics 38. https://doi.org/10.4401/ag-4127
- Caputo, R., Chatzipetros, A., Pavlides, S., Sboras, S., 2012. The Greek Database of Seismogenic Sources (GreDaSS): state-of-the-art for northern Greece. Annals of Geophysics 55, 859–894. https://doi.org/10.4401/ag-5168
- Caputo, R., Helly, B., Pavlides, S., Papadopoulos, G., 2004. Palaeoseismological investigation of the Tyrnavos Fault (Thessaly, Central Greece). Tectonophysics 394, 1–20. https://doi.org/10.1016/j.tecto.2004.07.047
- Caputo, R., Pavlides, S., 2013. Greek Database of Seismogenic Sources (GreDaSS)., University of Ferrara, Italy. https://doi.org/10.15160/UNIFE/GREDASS/0200 and , GreDaSS Working Group, 2014. The Greek Database of Seismogenic Sources (GreDaSS): the new version. EGU General Assembly 2014.
- Caputo, R., Pavlides, S., 1993. Late Cainozoic geodynamic evolution of Thessaly and surroundings (central-northern Greece). Tectonophysics 223, 339–362. https://doi.org/10.1016/0040-1951(93)90144-9
- Chatzipetros, A., Lazos, I., Pavlides, S., Pikridas, C., Bitharis, S., 2018. Determination of the active tectonic regime of Thessaly, Greece: a geodetic data based approach. XXI International Congress of the CBGA. Salzburg, 227.
- Kilias, A., Fasoulas, C., Priniotakis, M., Sfeikos, A., Frisch, W., 1991. Deformation and HP/LT Metamorphic Conditions at the Tectonic Window of Kranea (W -- Thessaly, Northern Greece). Zeitschrift Der Deutschen Geologischen Gesellschaft 142, 87–96. https://doi.org/10.1127/zdgg/142/1991/87
- Kilias, A., Mountrakis, D., 1987. Structural Geology of the Central Pelagonian Zone (Kamvounia Mountains, North Greece). Zeitschrift Der Deutschen Geologischen Gesellschaft 138, 211–237. https://doi.org/10.1127/zdgg/138/1987/211
- Kremastas, E., Pavlides, S., Chatzipetros, A., Koukouvelas, I., Valkaniotis, S. (2018). Mapping the Gyrtoni Fault (Thessaly, Central Greece) using an Unmanned Aerial Vehicle. Conference: 9th International INQUA Meeting on Paleoseismology, Active Tectonics and Archeoseismology (PATA), 25 – 27 June, 2018, Possidi, Greece
- Lazos, I., Pikridas, C., Chatzipetros, A., Pavlides, S., 2020. Determination of local active tectonics regime in central and northern Greece, using primary geodetic data. Applied Geomatics 1–15. https://doi.org/10.1007/s12518-020-00310-x
- Lin, J., Stein, R.S., 2004. Stress triggering in thrust and subduction earthquakes and stress interaction between the southern San Andreas and nearby thrust and strike-slip faults. J. Geophys. Res. Solid Earth 109, B02303.
- Papaioannou, I., 2019. The Larisa, Tyrnavos and Agia earthquake of 1892 [in Greek].
- Papaioannou, I., 2018. The Larisa earthquake of March 1, 1941 [in Greek].
- Papaioannou, I., 2017a. Earthquake activity in Thessaly during the 19th century [in Greek]., Thessaliko Imerologio 273–292.
- Papaioannou, I., 2017b. Earthquake activity in Thessaly during 16th-18th centuries [in Greek]., Thessaliko Imerologio 353–396.
- Papathanasiou G., Valkaniotis S., Chatzipetros A., Pavlides S. (2010a). Liquefaction susceptibility map of Greece. Bulletin of the Geological Society of Greece, XLIII(3), 1383-1392
- Papathanasiou G., Pavlides S. (2010b). Probabilistic evaluation of ground failures triggered by seismic loading in urban environment; case studies from Greece. Bulletin of the Geological Society of Greece, XLIII(3), 1373-1382.
- Papathanasiou G., Pavlides S. (2009). GIS-based DAtabase of historical Liquefaction Occurrences in broader Aegean region, DALO v1.0, Earthquake Geotechnical Engineering Satellite Conference. Proceedings of the XVII International Conference on Soil Mechanics & Geotechnical Engineering, Earthquake Geotechnical Engineering Satellite Conference. XVII International Conference on Soil Mechanics and Geotechnical Engineering, Earthquake Geotechnical Engineering Satellite Conference. Alexandria, Egypt.
- Papathanasiou G., Seggis K, Pavlides S. (2011). Evaluating earthquake-induced liquefaction in the urban area of Larissa, Greece. Bulletin of Engineering Geology and the Environment, 70(1), 79-88.
- Papazachos, B., Papazachou, A. (1997/2003). The Earthquakes of Greece. Ziti Publications. Thessaloniki.
- Pavlides, S.B., Caputo, R., 2004. Magnitude versus faults' surface parameters: quantitative relationships from the Aegean, Tectonophysics, 380(3-4), 159-188.
- Sboras, S., 2011. The Greek Database of Seismogenic Sources: seismotectonic implications for North Greece. PhD thesis, University of Ferrara.
- Sboras, S., Pavlides, S., Caputo, R., Chatzipetros, A., Michailidou, A., Valkaniotis, S., Papathanassiou, G., 2014. The use of geological data to improve SHA estimates in Greece. Bollettino Di Geofisica Teorica Ed Applicata 55. https://doi.org/10.4430/bgta0101.
- Tsodoulos, I., K. Stamoulis, R. Caputo, I. Koukouvelas, A. Chatzipetros, S. Pavlides, Ch. Gallousi, Ch. Papachristodoulou, K. Ioannides, (2016). Middle–Late Holocene earthquake history of the Gyrtoni Fault, Central Greece: Insight from optically stimulated luminescence (OSL) dating and paleoseismology. Tectonophysics, 687, 14-27, https://doi.org/10.1016/j.tecto.2016.08.015.
- Toda, S., Stein, R.S., Richards-Dinger, K., Bozkurt, S.B., 2005. Forecasting the evolution of seismicity in southern California: Animations built on earthquake stress transfer. J. Geophys. Res. B Solid Earth 110, 1–17.
- Wells, D.L. and Coppersmith, K.J., 1994. New empirical relationships among magnitude, rupture length, rupture width, rupture area, and surface displacement, Bulletin of the Seismological Society of America, 84, 974-1002.

 RSS Feed
